Description
Computes changes in the Gibbs free energy of the assembly process of a protein.
Usage
foldx.assembly(pdb, mol1, mol2, pH = 7, I = 0.05)
Arguments
pdb the 4-letter identifier of a PDB structure or the path to a PDB file.
mol1 molecule or group of molecules interacting with mol2 (see details)
mol2 molecule or group of molecules interacting with mol1 (see details)
pH a numeric value between 0 and 14.
I a value indicating the molar ionic strength.
Value
The function returns a dataframe with the residues that make up the interface between mol1 and mol2, as well as the change in Gibbs free energy, ΔG, of the assembly process for the requested subunits.
References
Schymkowitz et al (2005) Nucl. Ac. Res. 33:W382-W388.
Details
This function implements the FoldX’s command ‘AnalyseComplex’, which allows to determine the interaction energy between two molecues or two groups of molecules.
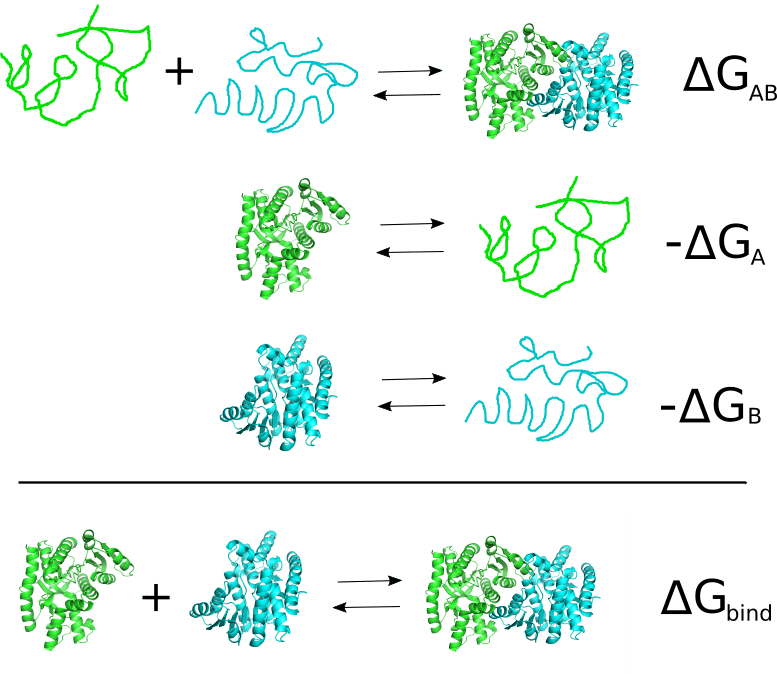
The interaction between two molecules is driven by the free energy of binding. For instance, let’s suppose we have a dimeric protein formed by two polypeptide: chain A and chain B. Then the binding reaction to be considere would be:


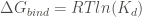


In order to calculate the free energy of binding of a complex AB, FoldX computes the Gibbs energies of the complex folding (


The function foldx.assembly() in addition to return the requested ΔG (kcal/mol), returns a dataframe with the residues from mol1 and mol2 involved in the intermolecular interaction. To illustrate the use of foldx.assembly() we are going to analyze an homodimeric protein as the human mitochondrial malate dehydrogenase (2dfd).
mdh <- foldx.assembly(pdb = '2dfd', mol1 = 'A', mol = 'B')
attributes(mdh)$Gibbs
## [1] -55.1663
attributes(mdh)$units
## [1] "kcal/mol"
Now, we can examine some of the 90 residues that configure the interface between the two monomers:
head(mdh)
##     id pos aa chain
## 1 QA20  20  Q     A
## 2 PA21  21  P     A
## 3 SA23  23  S     A
## 4 LA24  24  L     A
## 5 LA25  25  L     A
## 6 KA27  27  K     A
tail(mdh)
##       id pos aa chain
## 85 TB230 230  T     B
## 86 LB231 231  L     B
## 87 SB232 232  S     B
## 88 AB234 234  A     B
## 89 YB235 235  Y     B
## 90 RB239 239  R     B
Among the amino acids making up the binding interface, you may find symbols that may not be as familiar as those for the 20 proteinogenic amino acids. For instance, in the interface of malate dehydrogenase we got 3 residues ‘e’ (charged NE2 histidine) and 1 residue ‘o’ (charged ND1 histidine). The full list of recognized residues can be found here
Note: more elaborate vignette involving the use of foldx.assembly() can be reached here.
Warning: the function foldx.assembly() makes an extensive use of commands invoking the OS, reason why it may not work properly on Windows.
