Description
Computes the Depth from the Surface for Each Protein’s Residue.
Usage
res.dpx(pdb, aa = 'all')
Arguments
pdb is either a PDB id, or the path to a pdb file.
aa one letter code for the amino acid of interest, or ‘all’ for all the protein residues.
Value
A dataframe with the computed depths. The depth is defined as the distance in angstroms between the target residue and the closest atom on the protein surface. When the protein is composed of several subunits, the calculations are made for both, the residue being part of the complex, and the residue being only part of the polypeptide chain to which it belongs.
References
- Pintar et al. 2003. Bioinformatics 19:313-314
Details
Analysis of protein commonly requires the partition of their structure into regions such as the surface, interior, or interface. Whenever you are interested into analysing such a partition in a particular protein, the following function of the ptm package may be of help:
In order to obtain an accurate description of the protein interior, the function atom. dpx() provides meaures of the depth of each atom in the target protein, defined as its distance in Å from the closest solvent accessible atom. For instance, for calmodulin (CaM) a small monomeric protein:
aCaM <- atom.dpx('1cll')
kable(head(aCaM))
| eleno | elety | resid | resno | chain | areaenergy | dpx_complex | dpx_chain | delta_dpx |
|---|---|---|---|---|---|---|---|---|
| 1 | N | L | 4 | A | 39.60 | 0.00 | 0.00 | 0 |
| 2 | CA | L | 4 | A | 46.97 | 0.00 | 0.00 | 0 |
| 3 | C | L | 4 | A | 0.00 | 1.24 | 1.24 | 0 |
| 4 | O | L | 4 | A | 0.39 | 0.00 | 0.00 | 0 |
| 5 | N | T | 5 | A | 1.37 | 0.00 | 0.00 | 0 |
| 6 | CA | T | 5 | A | 0.00 | 1.47 | 1.47 | 0 |
while res.dpx() does the same but at the level of residues:
CaM <- res.dpx('1cll')
kable(head(CaM))
| res | resno | resid | chain | min_dpx_complex | avg_dpx_complex | max_dpx_complex | min_dpx_chain | avg_dpx_chain | max_dpx_chain |
|---|---|---|---|---|---|---|---|---|---|
| L-4-A | 4 | L | A | 0 | 0.31 | 1.24 | 0 | 0.31 | 1.24 |
| T-5-A | 5 | T | A | 0 | 0.72 | 2.27 | 0 | 0.72 | 2.27 |
| E-6-A | 6 | E | A | 0 | 0.14 | 1.25 | 0 | 0.14 | 1.25 |
| E-7-A | 7 | E | A | 0 | 0.30 | 1.47 | 0 | 0.30 | 1.47 |
| Q-8-A | 8 | Q | A | 0 | 0.30 | 1.47 | 0 | 0.30 | 1.47 |
| I-9-A | 9 | I | A | 0 | 0.68 | 2.41 | 0 | 0.68 | 2.41 |
Note that for each residue, the function returns three dpx measurement: the one for the atom with the minimum distance, the one for the atom with the maximum dpx, and the average dpx for all the atom from that residue. You can also note that because CaM is a monomeric protein, there is not point in comparing the dpx values compute for the monomer and the complex (both are the same).
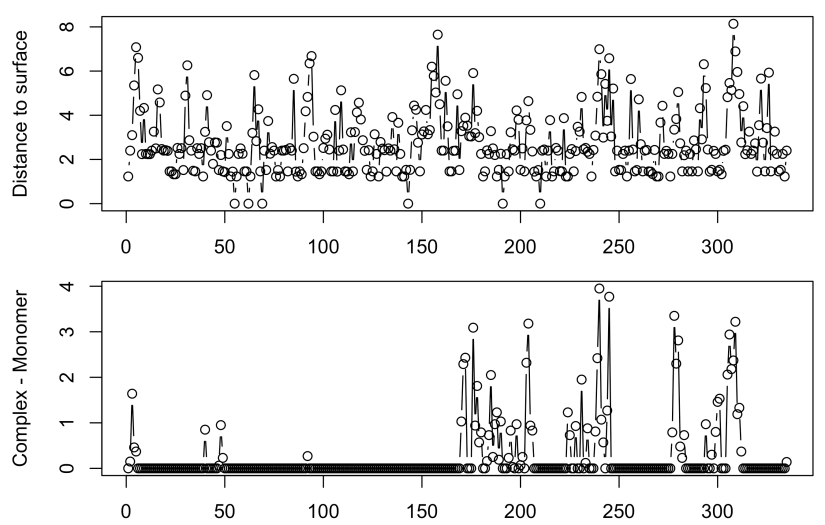
Now lets represent the dpx value along the primary sequence of a monomer of glyceraldehyde-3-phosphate dehydrogenase, a tetrameric protein.
GAPDH <- res.dpx('1u8f')
First using the minimum distance:
par(mfrow = c(2,1))
par(mar = c(2,4.1,1,2.1))
plot(1:335, GAPDH$min_dpx_complex[1:335], ty = 'b', ylab = 'Distance to surface')

Ddpx <- GAPDH$min_dpx_complex - GAPDH$min_dpx_chain # dpx_complex - dpx_monomer

plot(1:335, Ddpx[1:335], ty = 'b',
    xlab = 'Residue number', ylab = 'Complex - Monomer')
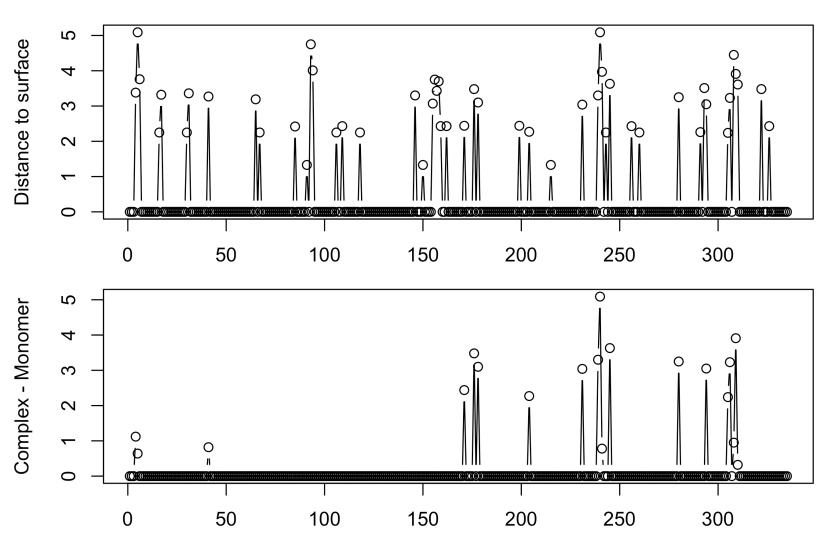
Then the averaged distance:
par(mfrow = c(2,1))
par(mar = c(2,4.1,1,2.1))
plot(1:335, GAPDH$avg_dpx_complex[1:335], ty = 'b',
     xlab = 'Residue number', ylab = 'Distance to surface')

Ddpx <- GAPDH$avg_dpx_complex - GAPDH$avg_dpx_chain # dpx_complex - dpx_monomer

plot(1:335, Ddpx[1:335], ty = 'b',
     xlab = 'Residue number', ylab = 'Complex - Monomer')
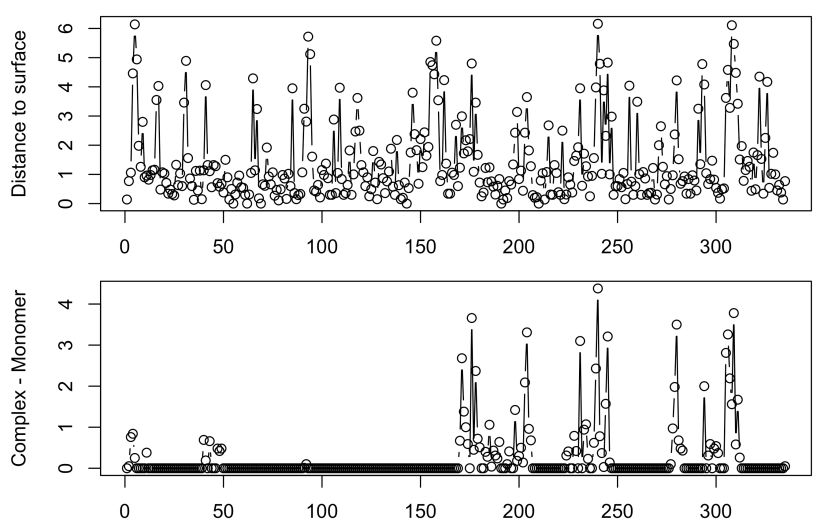
and finally, the maximum distance:
par(mfrow = c(2,1))
par(mar = c(2,4.1,1,2.1))
plot(1:335, GAPDH$max_dpx_complex[1:335], ty = 'b',
     xlab = 'Residue number', ylab = 'Distance to surface')

Ddpx <- GAPDH$max_dpx_complex - GAPDH$max_dpx_chain

plot(1:335, Ddpx[1:335], ty = 'b',
       xlab = 'Residue number', ylab = 'Complex - Monomer')